What is a Decision Tree?
By Matt Bass · November 17, 2021 ·HOW-TO
Decisions trees are a simple, yet surprisingly powerful data structure used in several machine learning models. They are used in ensemble models like XGBoost and Random Forest. An ensemble model is when the output is averaged across several different methods to obtain a better result. These are often powerful models that are versatile and easy to use.
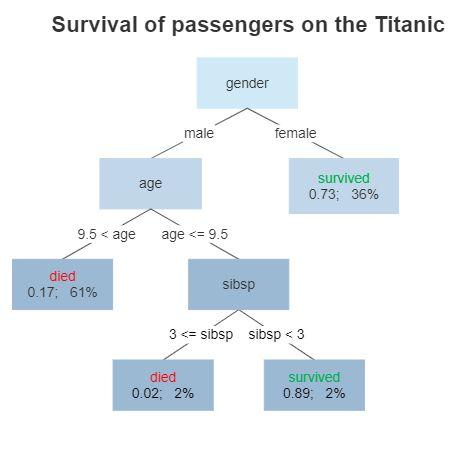
A decision tree is a flowchart-like structure in which each internal node represents a “test” on an attribute (e.g. whether a coin flip comes up heads or tails), each branch represents the outcome of the test, and each leaf node represents a class label (decision taken after computing all attributes). The paths from root to leaf represent classification rules.

Take it as it Comes
Random forests do not require the data to be normalized. Meaning you can throw your data into a model as-is. This greatly reduces the amount of time investment needed to produce a first prototype.
A model built with decision trees does not make the assumption the data is normally distributed. Normal distributions are commonly found in nature when some sort of inertia prevents very high or very low values. Many machine learning models require the input to be normalized in order to make the search space dense and centered on the origin (0).
Data does not need to be normalized because the business rules that power decision trees work on both ordinal and nominal (categorical) data. We could have a rule say where the color is equal to orange, or where the height is great than 5.
A common example of a normal distribution is the height of a population. The physiology of our bodies prevent us from being ten feet tall or 2 inches tall, our bodies are designed to operate within a certain range of height. Extreme outlier are not rare, but impossible. On the other hand an example of a non-normal distribution would be something like the number of followers an account has on Instagram. Many accounts will be 0 or less than 100. A few accounts will be in the millions, many thousand times greater than the population median.
Recursion
Decision trees by their design approach a problem recursively. Each iteration of the decision tree splits the remaining population into two discrete groups. Also, the feature that was used for the last node is removed from the pool of potential features. Each iteration reduces the dimensions of both the row and column space.
This property is called recursion. The problem gets smaller and the calculation becomes faster. Making this method effective for even very large data sets with many features. It has the trade off that nodes towards the root of the tree have a much higher impact than nodes lower down.
Parallel
Methods like Random Forest are made up of a collection of decision trees. The output of each decision tree can be calculated in parallel. This creates a simple way to score large data sets using multiple threads, processes, or machines. One example would be to use a map-reduce machine cluster like Hadoop to quickly score a large collection of input samples in parallel, then aggregating the results at the end.
Interpretation
Perhaps the strongest attribute of decision trees is in its ability to be interpreted. Most libraries that utilize an ensemble of trees will return a “feature importance” scoring show the impact each feature made on the final score. We can actually print out the decision trees themselves graphically like the image above. The closer a feature is to the root, the larger it’s impact. Because the amount of samples at each node decreases as you go down the tree.
If we find our random forest model useful, we can figure out exactly which features are most heavily weighted. Then we can conclude that those features are most important for influencing the outcomes we are measuring.
For transnational research, knowing why a model works is important. Seeing how the features are being used allow us to interpret the results and share the explanations. These attributes are important for scientific research.
Models that use deep learning are considered a black box. It is not possible to interpret what the model is doing, since it is taking a nonlinear transformation of the features represented as a vector. The deep learning model is using the associations and connections between the features in a complex way that is impossible to untangle. We tend to use deep learning for optimization problems when it is not important to understand how the model works.
Conclusion
Decision trees are a powerful tool but they come with limitations. They are extremely low bias, meaning they tend to overfit the data. Using a decision tree will basically tell you which records the training set are most similar to your input. Since plugging our input into the decision tree will lead us to a leaf node that will contain samples from our training set.
This is not always a useful thing. Let’s say we are interested in predicting something that lies outside our training set. The decision trees would have trouble generalizing since the trees were constructed using only seen data.
Decision trees are considered to be low variance. So they would be a poor fit for modeling a system with high variance, when we expect outcomes to differ from our training.
In this article I focused on the pros of using decision trees. I hope it has convinced you they are a useful data structure in your statistical modeling tool set.